
Spatial Transcriptomics: From Tissue to Insight
How AI is transforming the way we decode biology — one spot at a time
For decades, genomics told us what genes a cell expressed. But it couldn't tell us where in the tissue that expression happened — or how the spatial context shaped it. Spatial transcriptomics changes that. By pairing sequencing or imaging with precise tissue coordinates, it gives researchers a map, not just a list.
Here's a breakdown of the workflow and why it matters.
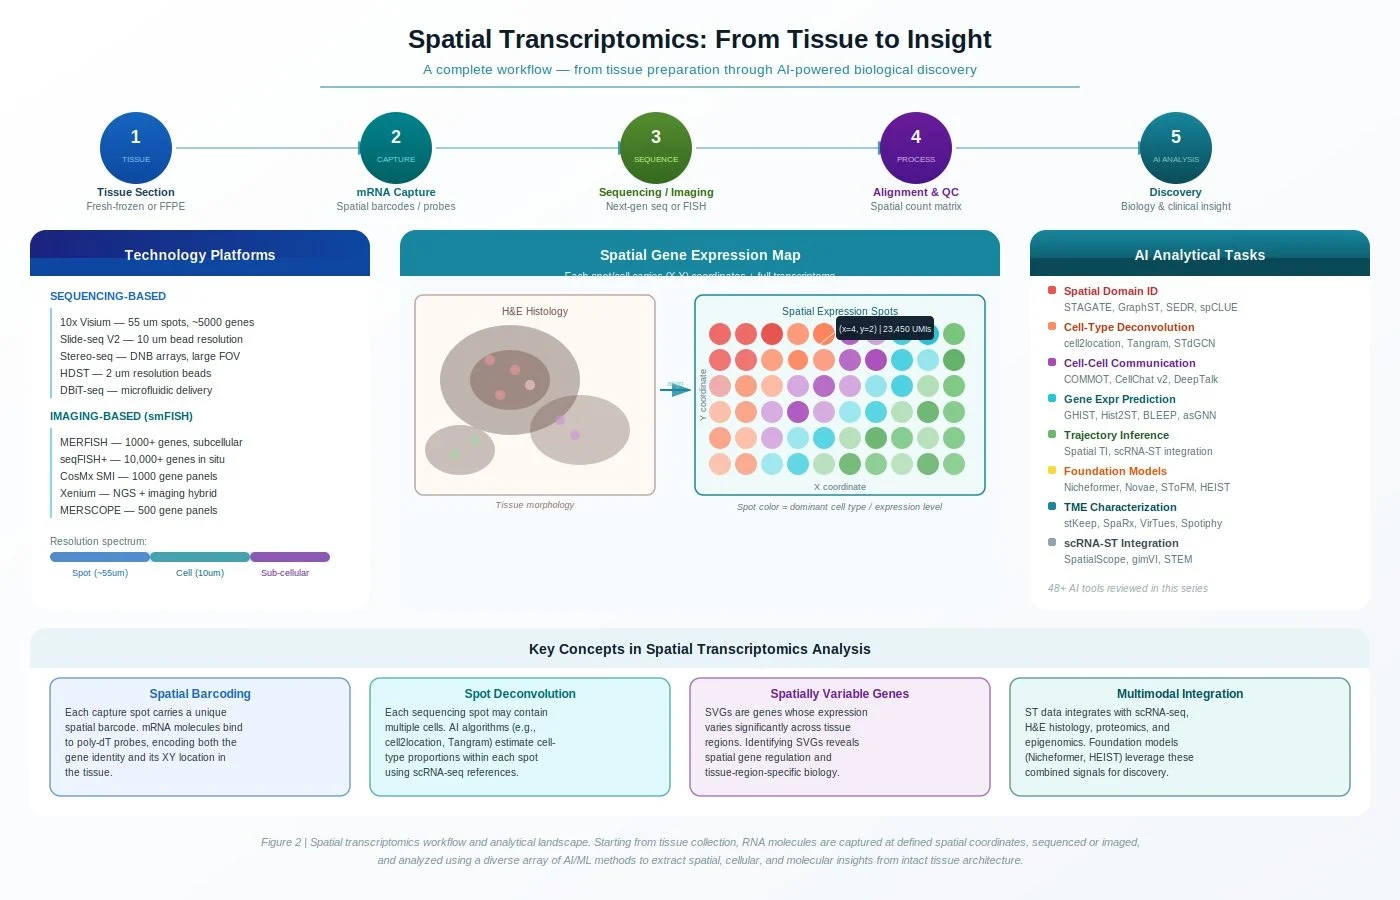
A workflow diagram showing the spatial transcriptomics pipeline across five steps: tissue sectioning, mRNA capture, sequencing/imaging, alignment/QC, and AI-driven discovery. It catalogs sequencing- and imaging-based platforms, illustrates how tissue morphology maps to gene expression spot grids, and summarizes eight AI analytical task categories with representative tools.
The 5-Step Workflow
1. Tissue Section The process begins with collecting tissue as either fresh-frozen or FFPE (formalin-fixed, paraffin-embedded) sections. Preserving intact tissue architecture at this stage is critical — because the spatial context of where genes are expressed is the entire foundation of the experiment.
2. mRNA Capture The tissue section is placed on a specially prepared slide embedded with spatial barcodes or probes. As mRNA molecules from the tissue bind to these probes, each barcode records both the gene's identity and its precise XY coordinates within the tissue, effectively tagging every transcript with a molecular address.
3. Sequencing or Imaging Depending on the platform, the captured transcripts are then detected either through next-generation sequencing (as in 10x Visium or Slide-seq) or through fluorescence-based imaging methods such as FISH (as in MERFISH or CosMx). Each approach offers a different balance of gene panel size, throughput, and spatial resolution.
4. Alignment & QC Raw sequencing reads or imaging signals are aligned to a reference genome and mapped back to their spatial barcodes. After quality control filtering, the result is a spatial count matrix — a structured dataset that links a full gene expression profile to every spot or cell position across the tissue section.
5. AI-Powered Discovery With the spatial count matrix in hand, computational and AI-driven methods take over. These tools identify tissue domains, deconvolve mixed cell populations, model cell-cell communication, and extract patterns that would be invisible in bulk or single-cell data alone — ultimately translating molecular signals into biological and clinical insight.
Choosing a Platform: Sequencing vs. Imaging
Not all spatial platforms are equal. The right choice depends on your resolution needs and gene panel size.
Sequencing-Based:
10x Visium — ~55 µm spots, ~5,000 genes; the most widely adopted platform
Slide-seq V2 — 10 µm bead resolution; higher spatial granularity
Stereo-seq — DNB arrays with large field of view
HDST — 2 µm resolution beads for near-subcellular detail
DBiT-seq — microfluidic delivery for precise reagent patterning
Imaging-Based (smFISH):
MERFISH — 1,000+ genes at subcellular resolution
seqFISH+ — 10,000+ genes captured in situ
CosMx SMI — 1,000 gene panels from Nanostring
Xenium — NGS + imaging hybrid from 10x Genomics
MERSCOPE — 500 gene panels with subcellular precision
Resolution ranges from spot-level (~55 µm) all the way down to sub-cellular — a spectrum that continues to shrink as technology advances.
What AI Does With the Data
Once the spatial count matrix is generated, a growing toolkit of AI and ML methods extracts meaning from it. Zetobit's review of this landscape covers 48+ tools across 8 analytical categories:
🔴 Spatial Domain Identification — Clustering tissue into biologically meaningful regions (STAGATE, GraphST, SEDR, spCLUE)
🟠 Cell-Type Deconvolution — Each sequencing spot may contain multiple cell types; AI estimates their proportions (cell2location, Tangram, STdGCN)
🟣 Cell-Cell Communication — Mapping ligand-receptor interactions across tissue space (COMMOT, CellChat v2, DeepTalk)
🔵 Gene Expression Prediction — Predicting expression from histology images alone (GHIST, Hist2ST, BLEEP, asGNN)
🟢 Trajectory Inference — Modeling cellular state transitions across tissue (Spatial TI, scRNA-ST integration)
🟡 Foundation Models — Large pretrained models for spatial biology (Nicheformer, Novae, SToFM, HEIST)
🩵 TME Characterization — Profiling the tumor microenvironment spatially (stKeep, SpaRx, VirTues, Spotiphy)
⚫ scRNA-ST Integration — Combining single-cell and spatial data for richer resolution (SpatialScope, gimVI, STEM)
Key Concepts to Know
Spatial Barcoding: Each capture spot carries a unique barcode that encodes both the gene identity and its XY location — the molecular "address" of expression.
Spot Deconvolution: Because spots (~55 µm) are larger than individual cells, AI algorithms estimate the mix of cell types present within each spot.
Spatially Variable Genes (SVGs): These are genes whose expression changes meaningfully across tissue regions — powerful markers for spatially regulated biology.
Multimodal Integration: Spatial data doesn't live in isolation. It integrates with scRNA-seq, H&E histology, proteomics, and epigenomics. Foundation models like Nicheformer and HEIST are being built specifically to learn from these combined signals.
Spatial transcriptomics is no longer an emerging technology — it's becoming a standard layer of the multi-omic stack. At Zetobit, we help life science organizations navigate platform selection, pipeline design, and AI-powered analysis to turn spatial data into actionable biological insight.
Stay tuned for deeper dives into specific tools and use cases across our Bioinformatics Insights Series.
Ready to add spatial context to your research or drug program? Zetobit supports the full spatial transcriptomics workflow — platform selection, pipeline design, AI-powered domain identification, cell-type deconvolution, and clinical interpretation. Book a free 20-minute consultation →