


Expert analysis at the intersection of AI, bioinformatics, and genomics.
Breaking down the science shaping precision medicine — from whole-genome sequencing and liquid biopsy to spatial transcriptomics, proteomics, and metabolomics — grounded in peer-reviewed literature and written for the people building the next generation of life sciences products.
The archive now runs to roughly 100 articles. Use the search below to find the ones relevant to your work.
Search the blog by entering the keywords below and hitting “Enter“
Editorial Notice
Disclaimer
What this blog is, what it is not, and the terms on which it is published.
Scope
The content published on this blog by Zetobit LLC is provided for general educational and informational purposes only. It reflects the professional views of the author, Kanna Nandakumar, PhD, and does not represent the views of any current or former employer, client, or institution.
Not advice
Nothing here constitutes medical, clinical, diagnostic, or legal advice. It is not a substitute for consultation with a qualified physician, genetic counselor, or the laboratory that issued a given test result, and it must not be used to make diagnostic or treatment decisions. Reading this material does not create a client, consulting, or professional relationship with Zetobit LLC.
Illustrative content
All report excerpts, figures, variants, and data shown are synthetic or illustrative. They contain no patient data and describe no real individual.
Currency & accuracy
Scientific literature, professional guidelines, and regulatory requirements change. Articles reflect the state of the field as of their publication date and are not updated. While the author makes reasonable efforts to verify claims and cite primary sources, no warranty is made as to accuracy or completeness, and Zetobit LLC accepts no liability for any action taken in reliance on this content.
Last updated August 2026
Questions about this notice — zetobit.com/contact
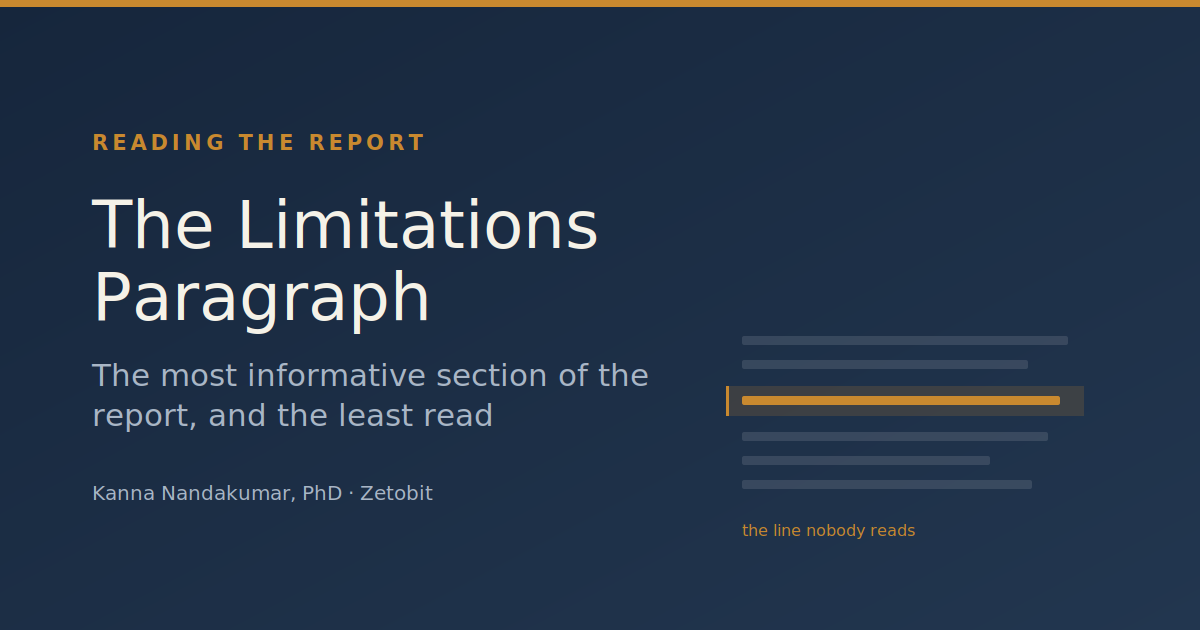
The Limitations Paragraph: The Most Informative Section of the Report, and the Least Read
Near the end of every genetic test report sits a block of text most readers treat as legal furniture. It has the cadence of a terms-and-conditions notice, it looks identical on every report, and so it gets skipped. That last observation is the one being misread. Everything else on the report describes one patient. The limitations section is the only part that describes the test — and professional standards require the laboratory to record there which regions of its own assay performed poorly during validation. It is a specification sheet filed under a heading that makes it look like a waiver.
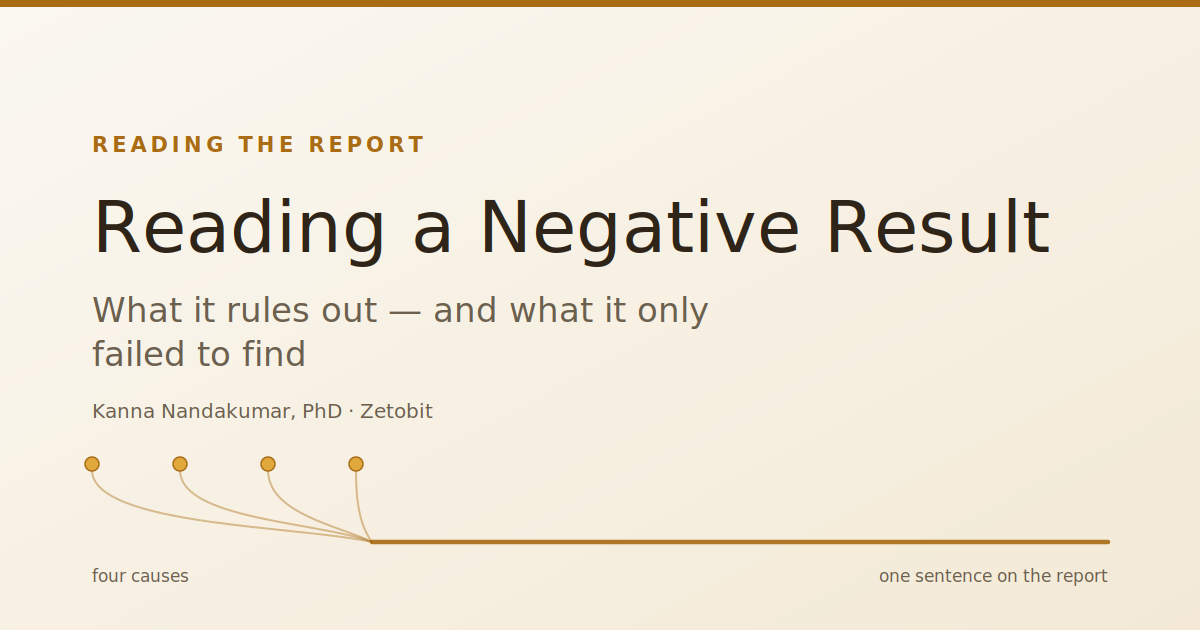
Reading a Negative Result
A positive result opens a management discussion. A variant of uncertain significance announces its own unfinished state. "No reportable variant identified" reads like closure — and it is the only result class that quietly expires. Four different situations produce that identical sentence: the cause sat outside the search space, it sat inside but was never covered, it was called correctly but was not yet recognizable as an answer, or there is nothing to find. The report documents the first two and cannot distinguish the last two. In the largest study of genome sequencing after a nondiagnostic workup, 72% of the new diagnoses were in variant classes the earlier coding test could already have seen.

Reading a VUS
A germline panel comes back and one line reads: variant of uncertain significance. It is natural to read the five-tier scale as a spectrum, with a VUS somewhere near the middle. It isn't. The classification is a statement about the evidence, not about the variant — and for management purposes it is an absence of a result in both directions, raising risk no more than it lowers it. Yet 51% of average-risk breast cancer patients who received a VUS underwent bilateral mastectomy, against 42% of those whose testing found nothing at all. Most uncertainty, given time, resolves toward benign.
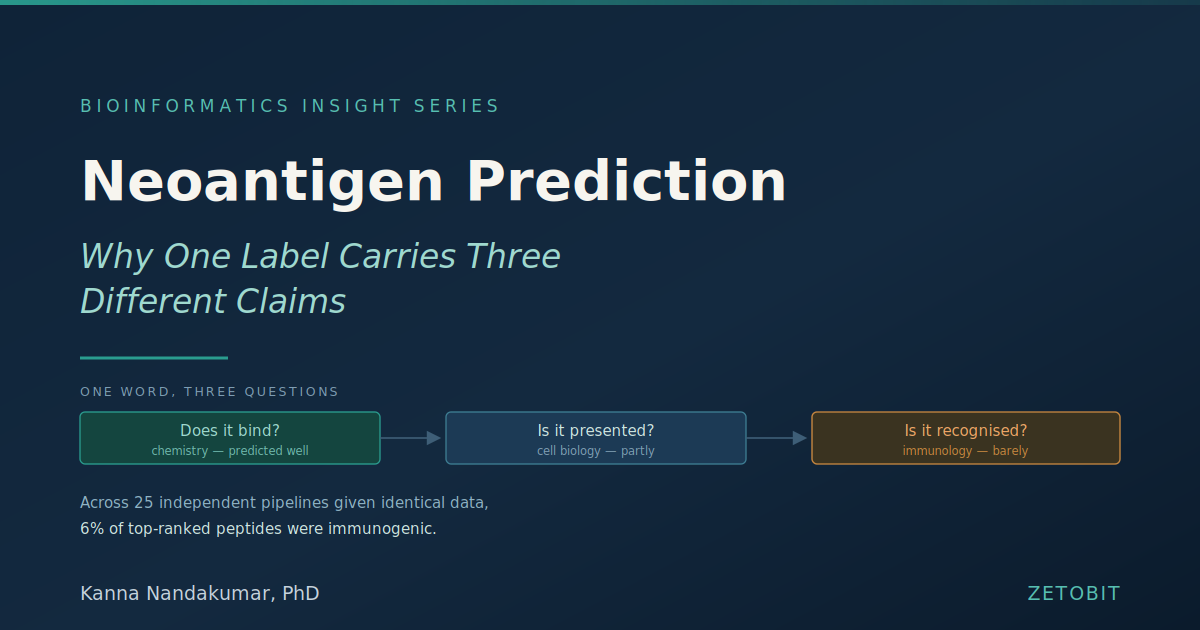
Neoantigen Prediction
A pipeline outputs "predicted neoantigens," and that one label compresses three claims resting on different evidence: the peptide binds MHC, it's actually presented, and a T cell recognises it. When 25 teams were given identical sequencing from six tumours, 608 top-ranked peptides were tested and 37 — 6% — were immunogenic. Median overlap between any two teams' top 100 was 13%, and it wasn't explained by variant calling. The reframing sits in one finding: there were no substantial differences between teams in how well they predicted MHC binding. The disagreement is entirely in the layers where the tools have least evidence.
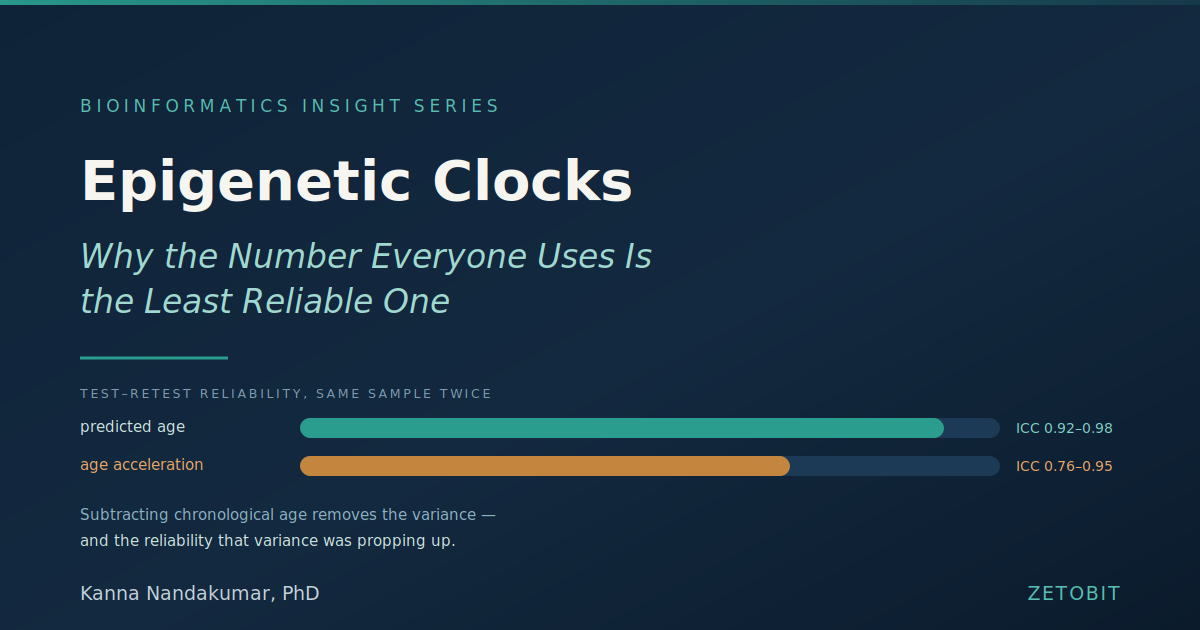
Epigenetic Clocks
A methylation age arrives with units, so the gap between it and a passport age reads like a measurement. It's a regression prediction, and the gap is a residual. Run the same DNA twice and six prominent clocks deviate by up to nine years; the Horvath clock shows a median difference of 2.1 years between technical replicates. But the sharper problem is statistical. The clocks' reliability looks excellent — ICCs of 0.917 to 0.979 — while age acceleration, the quantity almost everyone actually analyses, falls to 0.755 to 0.948. Subtracting chronological age removes the variance the reliability was resting on
Normalization Assumptions
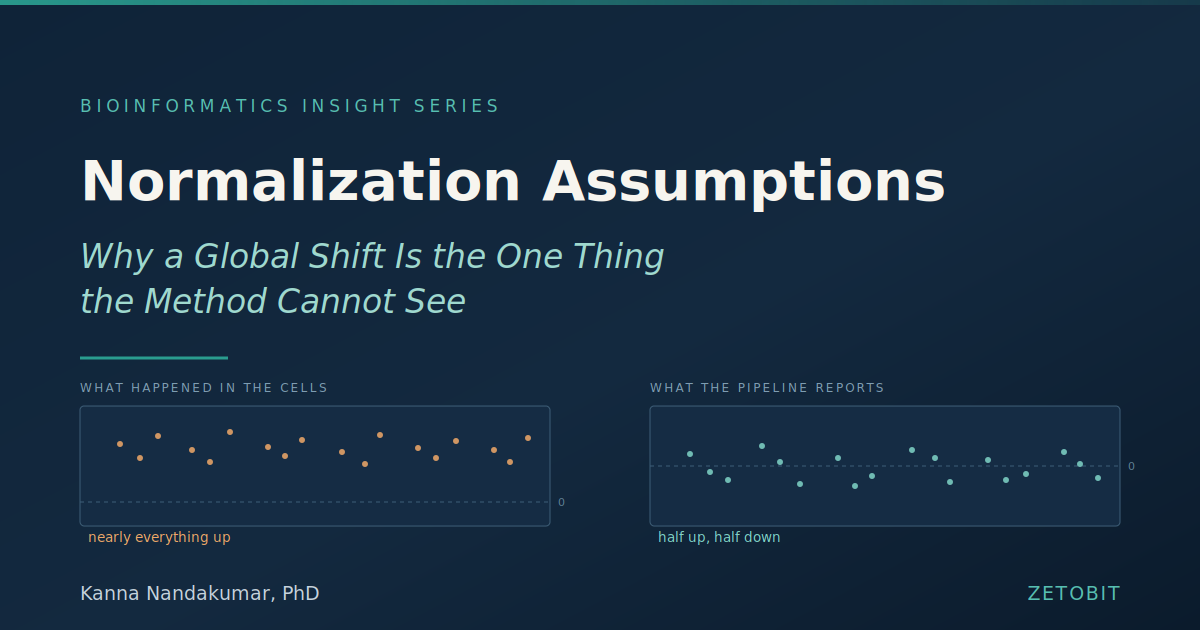
An RNA-seq count is expression multiplied by an unknown constant. Normalization estimates that constant, and to estimate it from the data you must assume something is invariant — for TMM and median-of-ratios, that most genes aren't changing. Under global transcriptional amplification that fails in every way at once. In P493-6 cells, standard normalization suggested some genes up and others down; spike-ins reflecting cell number showed transcript levels rising for the vast majority. Total RNA from the same number of cells differed by nearly 1.8-fold. And the failure is self-concealing: normalization enforces its own assumption on the output, so a balanced volcano plot is exactly what you'd see either way.
De Novo Mutation Calling
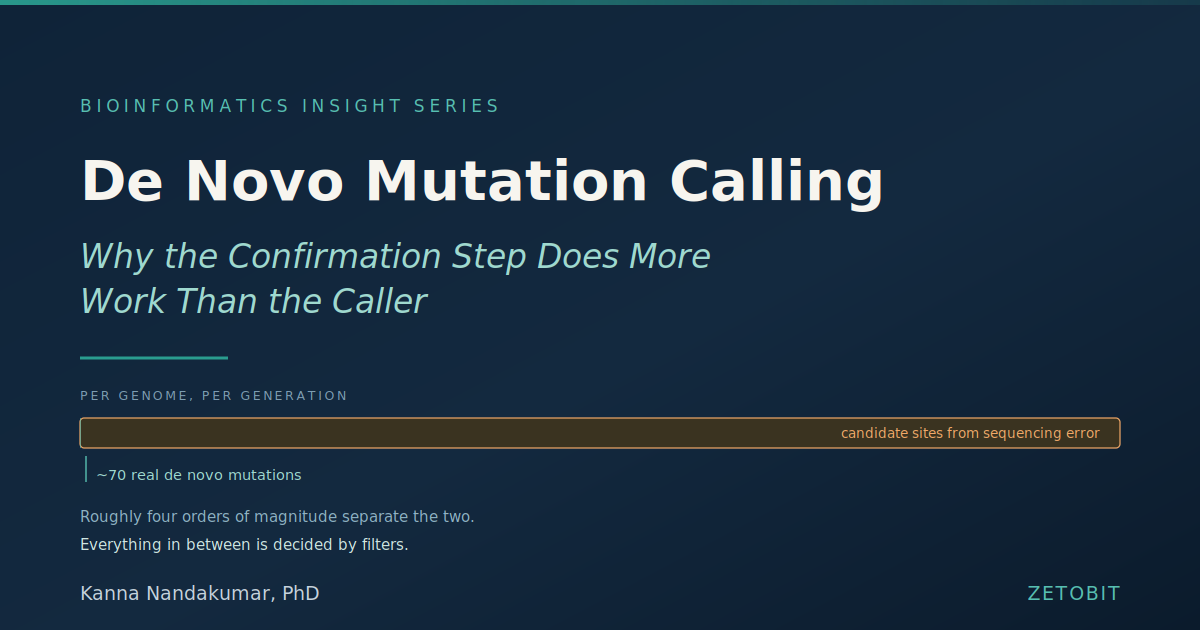
De novo mutation calling has an arithmetic problem before it has a software problem. The event occurs at roughly one in 10⁸ positions per generation; sequencing and mapping errors occur orders of magnitude more often, so Mendelian inconsistencies outnumber true mutations by about four orders of magnitude. Everything downstream of the caller — filters, masks, orthogonal confirmation — determines what the callset contains, and filtering choices alone moved a mutation-rate estimate twofold on identical data. Then there is a third category: a parental mosaic at 1% allele fraction isn't missed by a standard trio, it was never observable. The genotypes look identical. The recurrence risk does not.
Inter-Laboratory Discordance
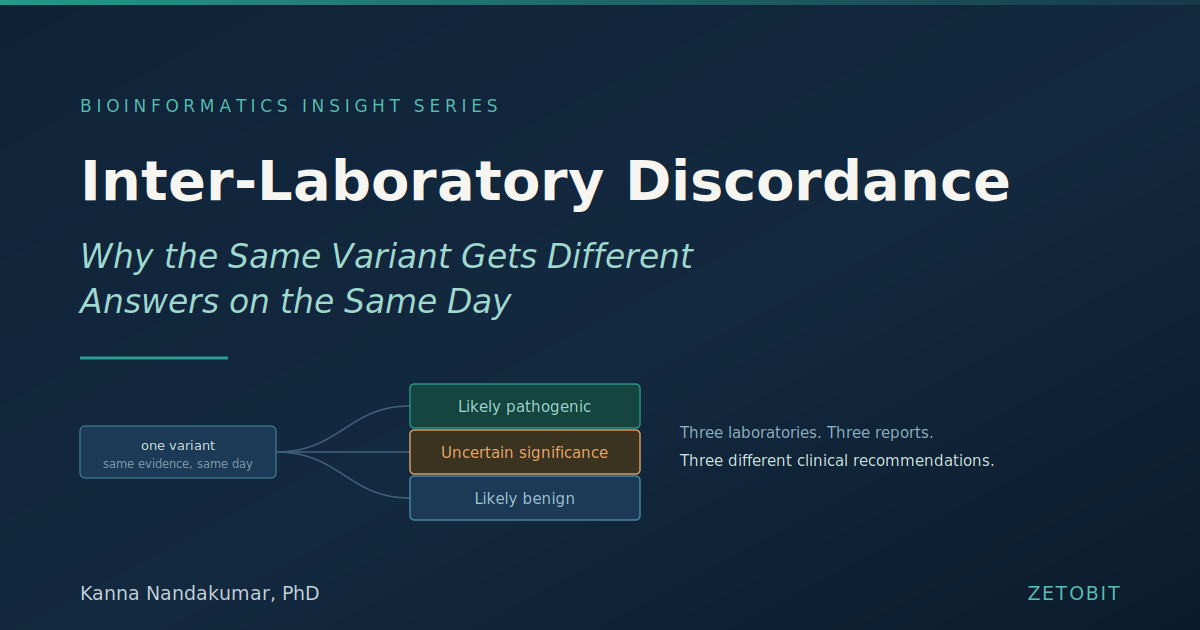
A pathogenicity classification looks like a property of the variant. It is closer to a property of the laboratory that issued it. Nine laboratories classifying 99 variants agreed 79% of the time internally and 34% across laboratories — and adopting the shared ACMG framework produced no significant improvement over each lab's own rules. But the interesting finding is why. When four laboratories documented the basis for their differences, 36% were stale records, 17% were reinterpretations not yet submitted, and 33% were internal evidence one lab held and another did not. Only 14% was the same evidence read differently. Most apparent disagreement is a timestamp problem or an access problem.
Allele Frequency Filters
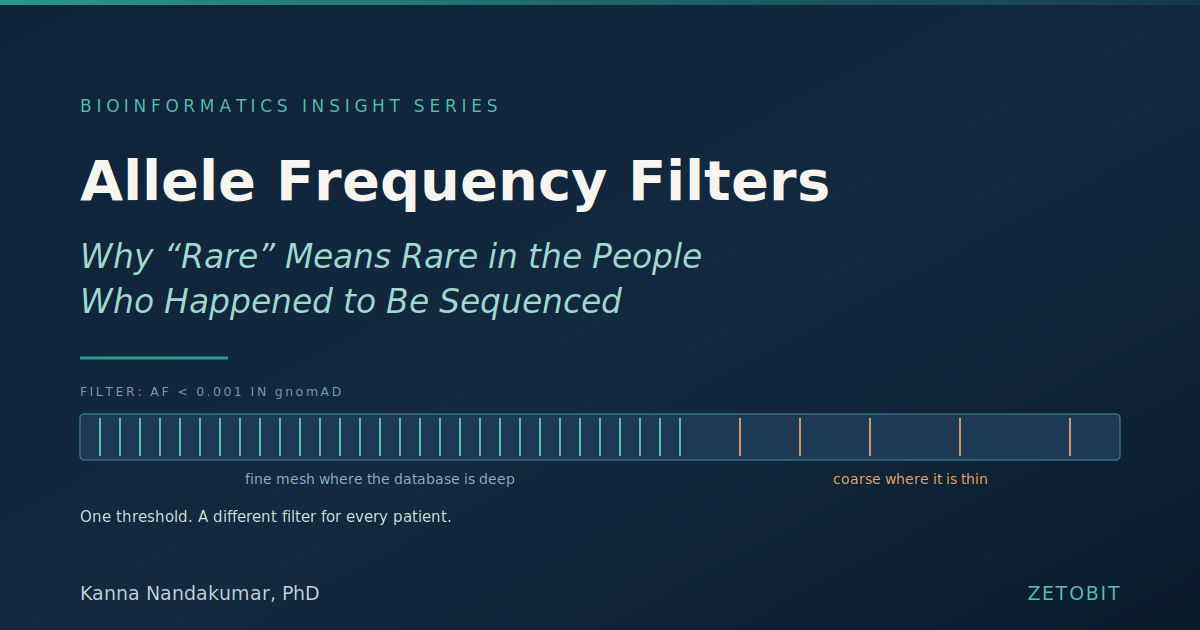
Every rare-disease pipeline runs the same filter early and hard: drop anything above some allele frequency in gnomAD, and a few million variants become a few hundred. The line encodes an assumption — that the frequency in the database estimates the frequency in the patient. When the patient's population is thinly sequenced, the same threshold behaves like a weaker filter, silently. Multiple patients of African ancestry received positive hypertrophic cardiomyopathy reports on variants later recategorised as benign; a control cohort of 200 people, 10% of them Black Americans, would have had a 50% chance of preventing it. And over a million variants became filterable for non-European patients in one gnomAD release.
Circularity in Variant Prediction
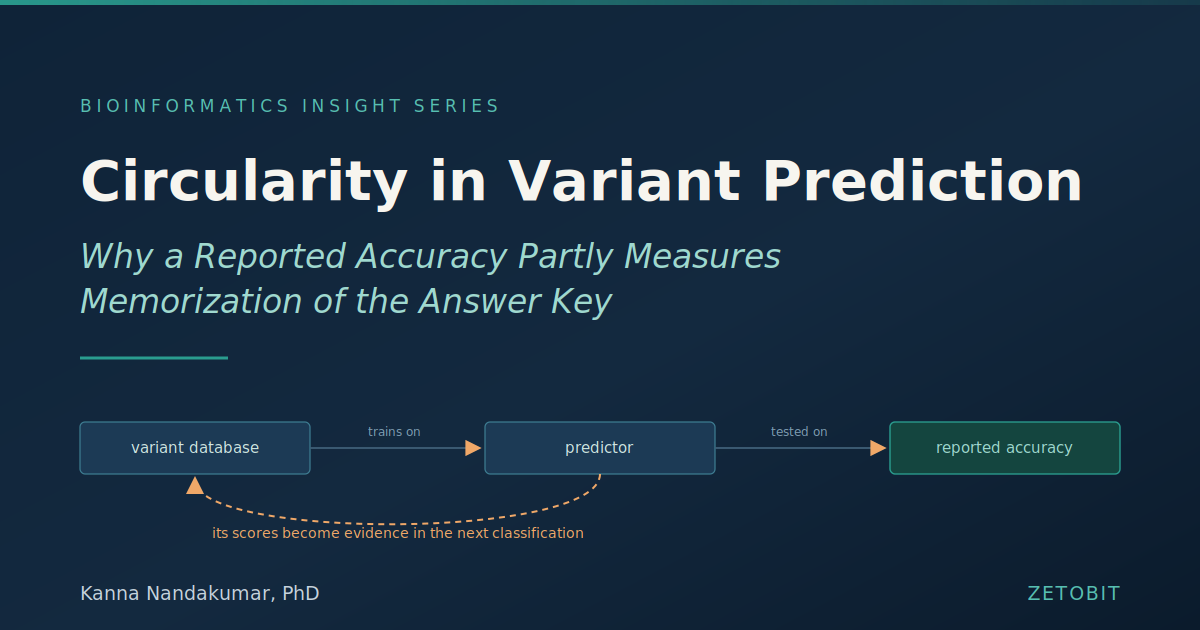
A missense predictor arrives with an AUC around 0.9. The number is computed correctly; the question is what it's a number about. Variant databases label genes almost uniformly — in one independent benchmark, 98% of proteins contained variants of a single class only, and 95% of variants sat in those proteins. A "predictor" that scores a variant purely by the pathogenic-to-neutral ratio of other variants in the same gene, ignoring the substitution entirely, beat the best real tool. And the loop has since closed: PP3/BP4 computational evidence was applied to 55% of expert-curated missense variants, so tools are now scored against labels they helped assign.
Sex Chromosome Handling
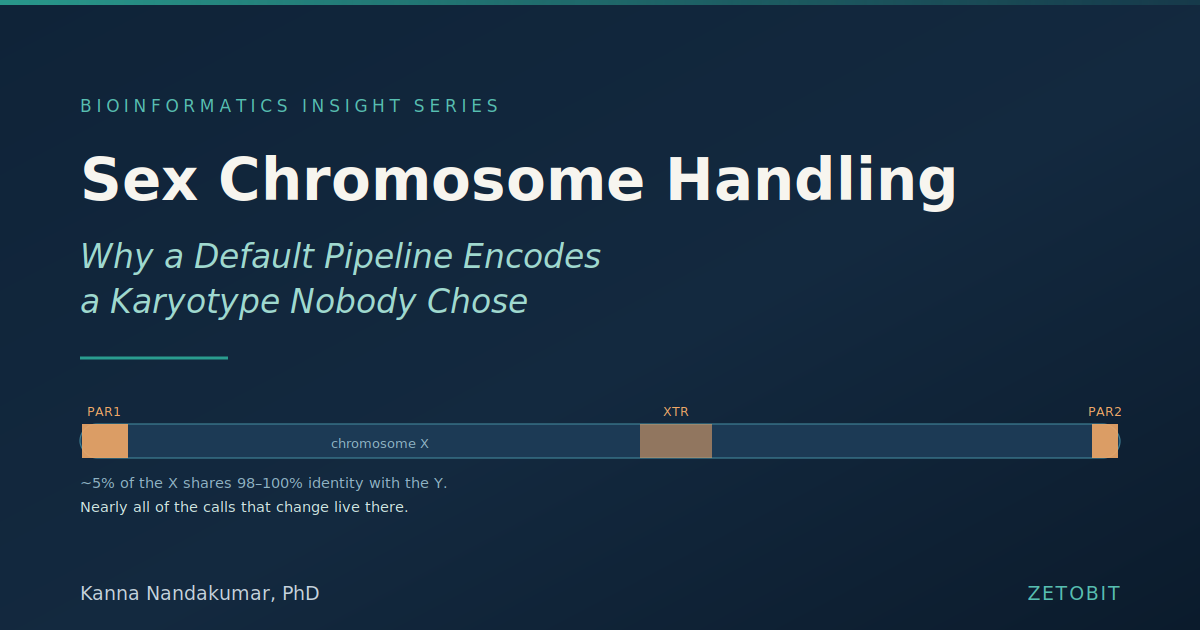
The human reference is a haploid representation of a diploid organism — except it carries both X and Y, making it an n = 24 representation of an n = 23 genome. Not every sample has a Y, and where both are in the index, reads from the 98–100% identical regions have two equally good destinations. Across 49 samples, switching to a complement-matched reference left chromosome 8 unchanged and raised PAR variants by 730%. A diploid allele-number filter applied to haploid X and Y left zero true positives. Three decisions — reference, ploidy, thresholds — each with a default set by someone else, none recorded in the VCF.
Gene Symbol and Ontology Drift
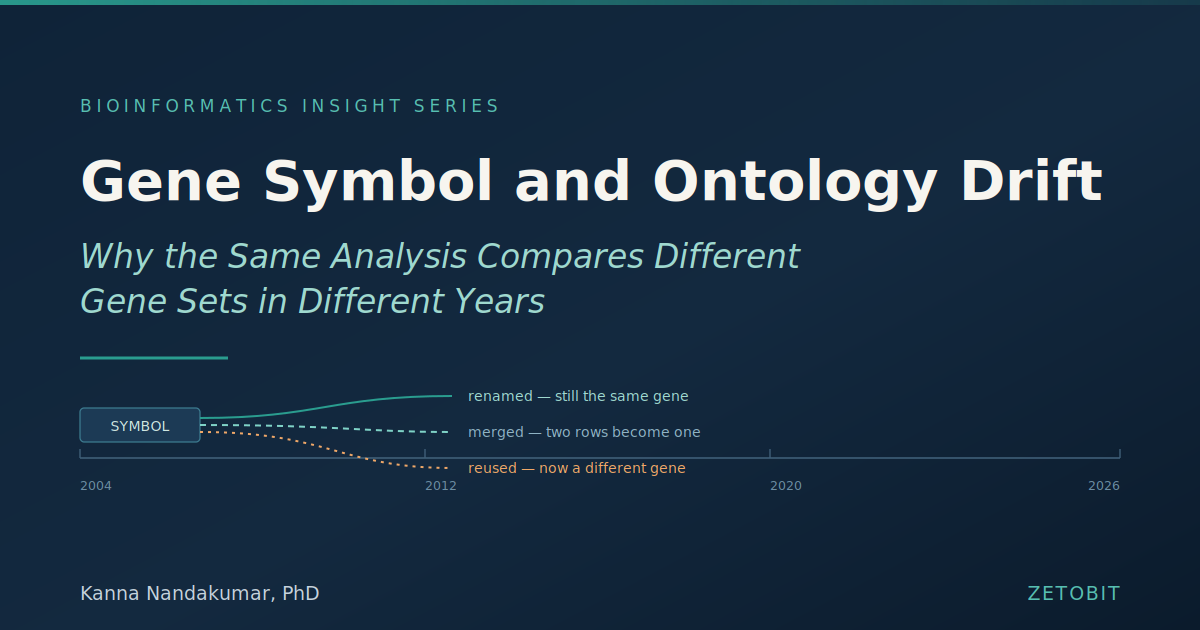
A gene symbol looks like the most solid thing in a results table — a short string naming a real object, joining cleanly to anything using the same string. Symbols get renamed, retired, merged, and used simultaneously as the approved symbol for one gene and an alias for another. Across 20,716 GEO platform files, invalid symbols ran ~3% in recent platforms and 30–40% in the earliest. Two of the four failure modes produce no match and can be counted. The other two produce a match: FHL1 is a valid approved symbol and also an alias for CFH, a different gene on a different chromosome. A corrector returns it as valid.
Cross-Species Read Assignment
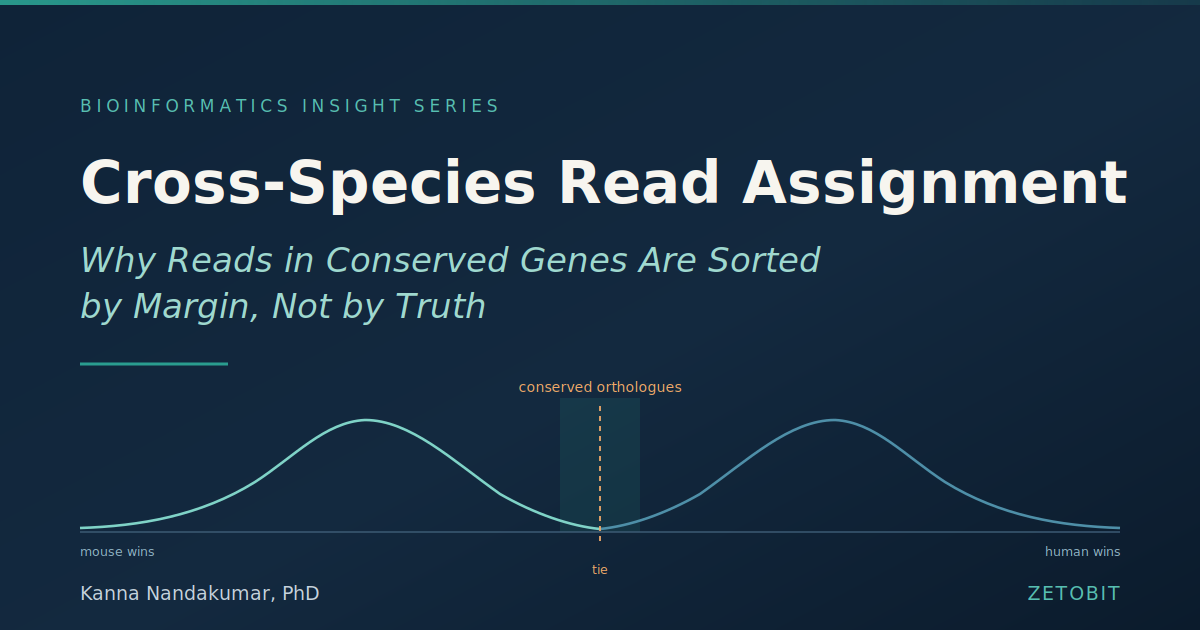
A xenograft is two organisms in one tube, and every read has to be assigned to one of them before any expression value exists. Align to both references, give the read to whichever genome fits better — where the fit is decisively better, the answer is a fact about the molecule; where the two scores differ by a point, it's a fact about the rule. In a pure human cDNA dataset, one method assigned 29 reads to MYH3 and another assigned 2,713, because the gene is conserved and the reads aligned equally well to both species. Mouse reads are mappable to 49% of the human genome and 409 cancer genes.
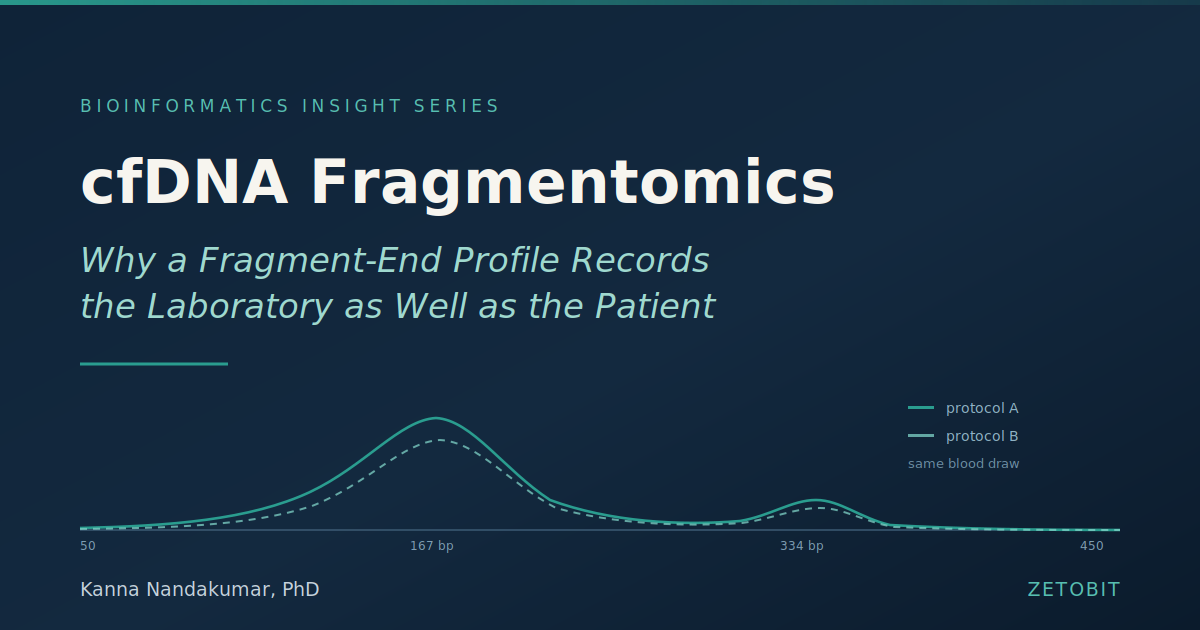
cfDNA Fragmentomics
Mutation-based liquid biopsy asks a question with a physical answer. Fragmentomics reads the shape of the molecules — length, where the short ones concentrate, which bases sit at their ends — and shape is what every step between the vein and the FASTQ can modify. The surprise is where the fragility actually sits. Tube type, processing delay and centrifugation protocol left fragment size largely alone; what they moved were genome-wide profiles, end motifs and mitochondrial cfDNA. Healthy controls from two centres separated by centre despite an identical written protocol, in both tubes. And trimming and alignment settings affected fragment length more than the choice of library kit did.
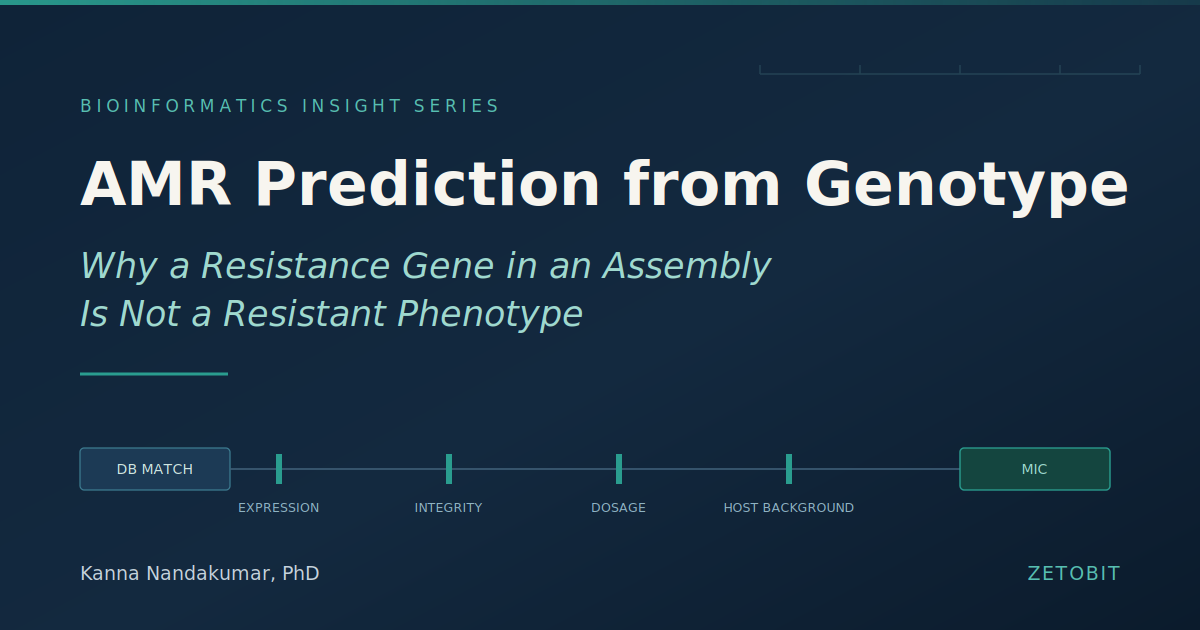
AMR Prediction from Genotype
A gene finder reports blaOXA-23 and the finding becomes "carbapenem-resistant" somewhere on the way to the clinic. What the pipeline established is that a contig region matched a database entry above a threshold. Whether the gene is transcribed, whether the protein is intact, how many copies the cell carries, and what the rest of the genome does to drug influx are all unobserved — and each fails silently, because a gene finder has no output for present and irrelevant. Carbapenem-susceptible isolates carry blaOXA-23 without the upstream insertion sequence that supplies its promoter. Oxacillin-susceptible mecA-positive S. aureus reached 24% of community-acquired MRSA in one collection. Across 766 organism–drug combinations, 27.4% were heteroresistant, mostly through unstable tandem amplifications a consensus assembly collapses to a single copy.
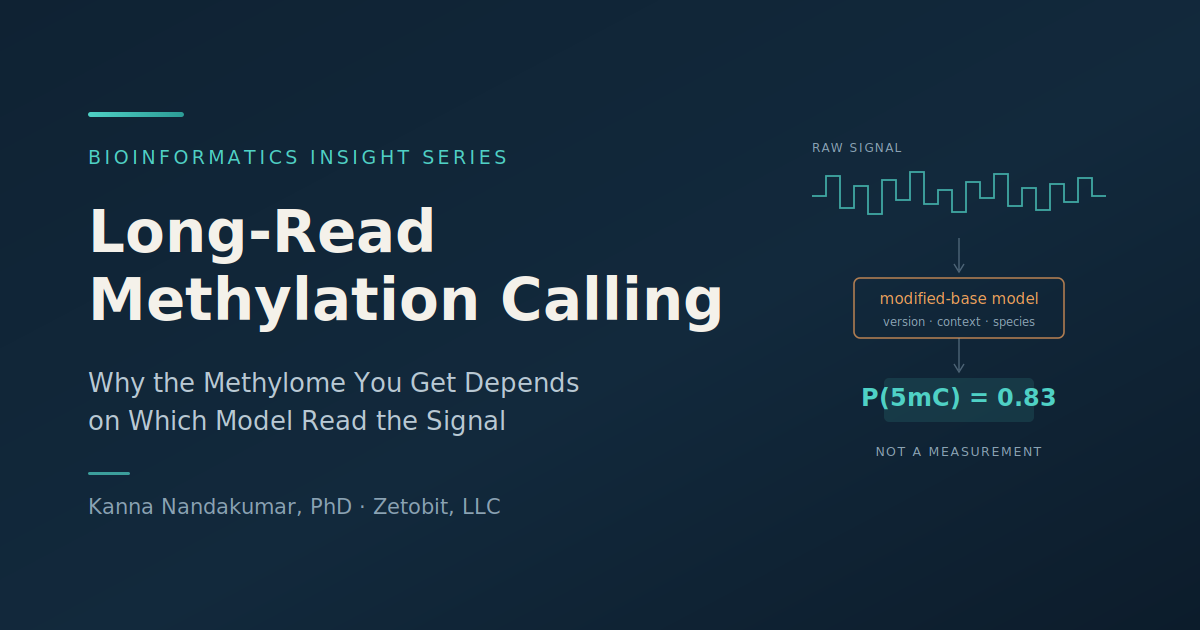
Long-Read Methylation Calling: Why the Methylome You Get Depends on Which Model Read the Signal
Bisulfite sequencing converts unmethylated cytosine chemically, so the methylation state is written into the sequence and read out like any other base. Long-read platforms don't convert anything — they record the raw current and hand it to a neural network that returns a probability the base was modified. That's a different kind of claim. Swapping the model changes the methylome without changing the DNA: an independent July 2026 evaluation found the newest high-accuracy model did not always beat its predecessor, and a purpose-built plant model improved CHH correlations by up to 118% over the general-purpose one.
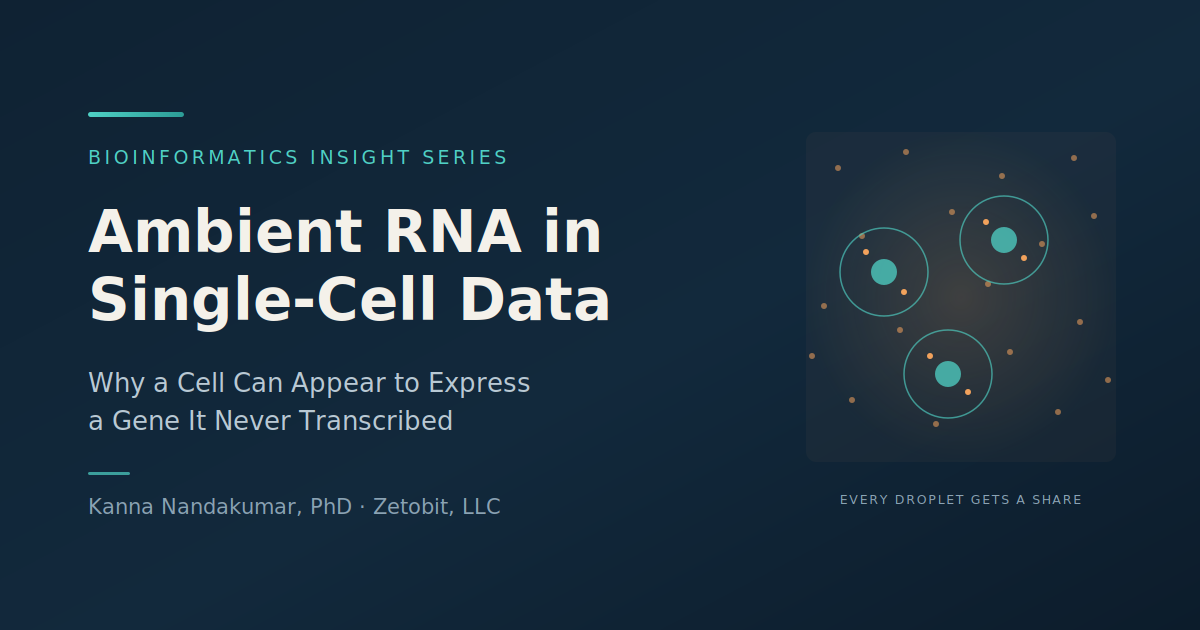
Ambient RNA in Single-Cell Data: Why a Cell Can Appear to Express a Gene It Never Transcribed
Dissociation ruptures cells, and their mRNA goes into the suspension. Every droplet that captures a cell also captures a sample of that free-floating pool, and those molecules are counted against the cell's barcode. It isn't random noise — it's a systematic addition weighted toward whatever the most abundant cells were transcribing, applied to every cell in the experiment. Contamination ranges from 2% to 50% across experiments. In brain single-nucleus data, all glia carry neuronal ambient RNA, and roughly 80% of the markers defining a published "immature oligodendrocyte" population turned out to be ambient transcripts. The cell type dissolved on reanalysis.
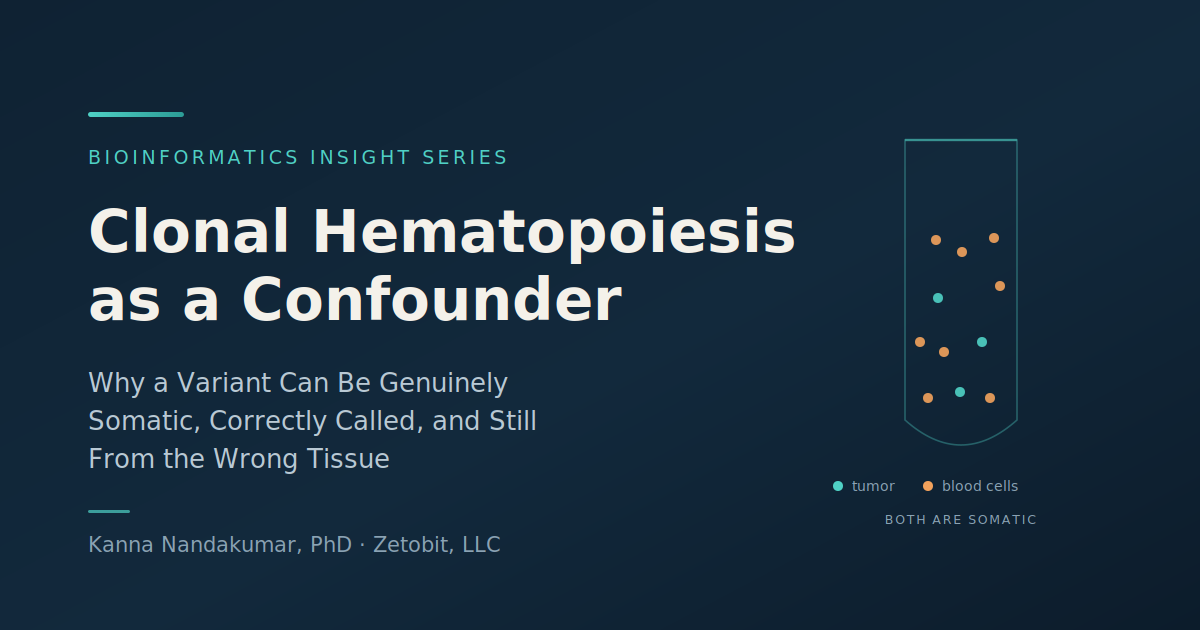
Clonal Hematopoiesis as a Confounder: Why a Variant Can Be Somatic and Still From the Wrong Tissue
Every QC mechanism a somatic pipeline has is designed to answer one question: is this variant real? Clonal hematopoiesis defeats all of them by satisfying the criterion. A CH variant is a genuine somatic mutation, present in the specimen, reproducible on orthogonal testing, correctly called — and not from the tumor. In one deep-sequencing study, 81.6% of cfDNA mutations in controls and 53.2% in cancer patients had features consistent with clonal hematopoiesis. Across 16,812 liquid profiles, 39% of detected BRCA2 variants were of CH origin. The pipeline has no filter for provenance, because provenance was never something a variant caller was asked to determine.
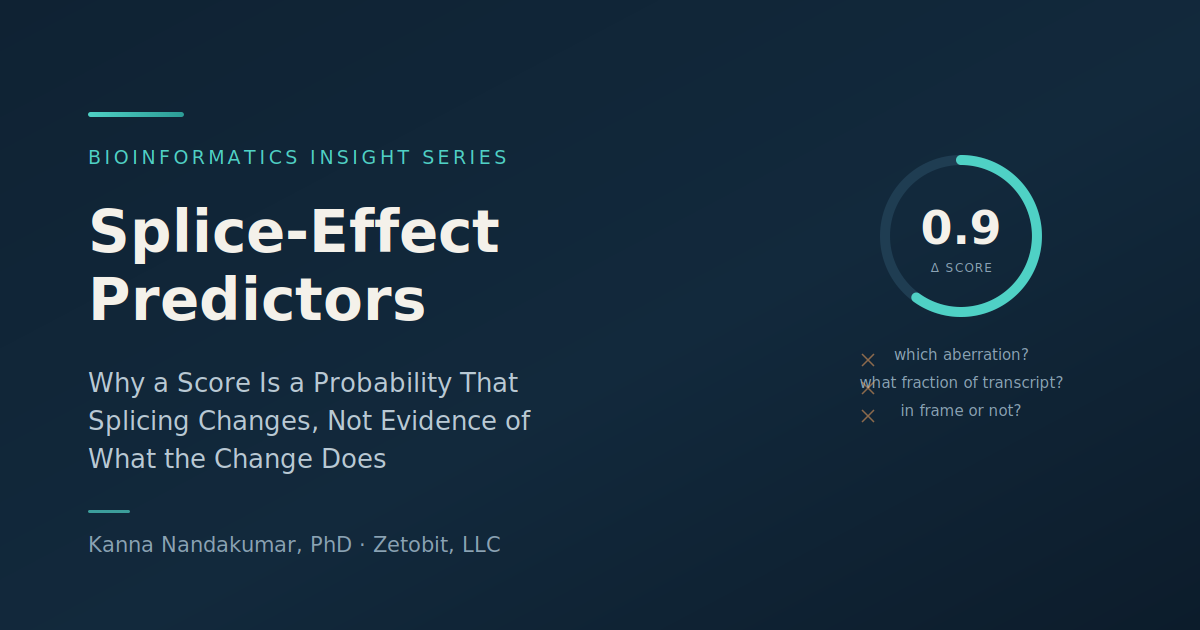
Splice-Effect Predictors: Why a 0.9 Is a Probability, Not a Consequence
A SpliceAI delta score of 0.9 is often read as near-certainty that a variant is pathogenic through a splicing mechanism. It isn't that. The score estimates the probability that splicing is altered — whether the transcript changes, not what the changed transcript is, what fraction of the mRNA pool carries it, or whether the protein breaks. The threshold at which the score becomes evidence isn't a property of the tool either: ClinGen SVI calibrated PP3 at 0.2 and BP4 at 0.1, the RUNX1 expert panel uses 0.38, an NF1 evaluation found 0.22, and deep intronic sensitivity at 0.5 was originally just 41%.
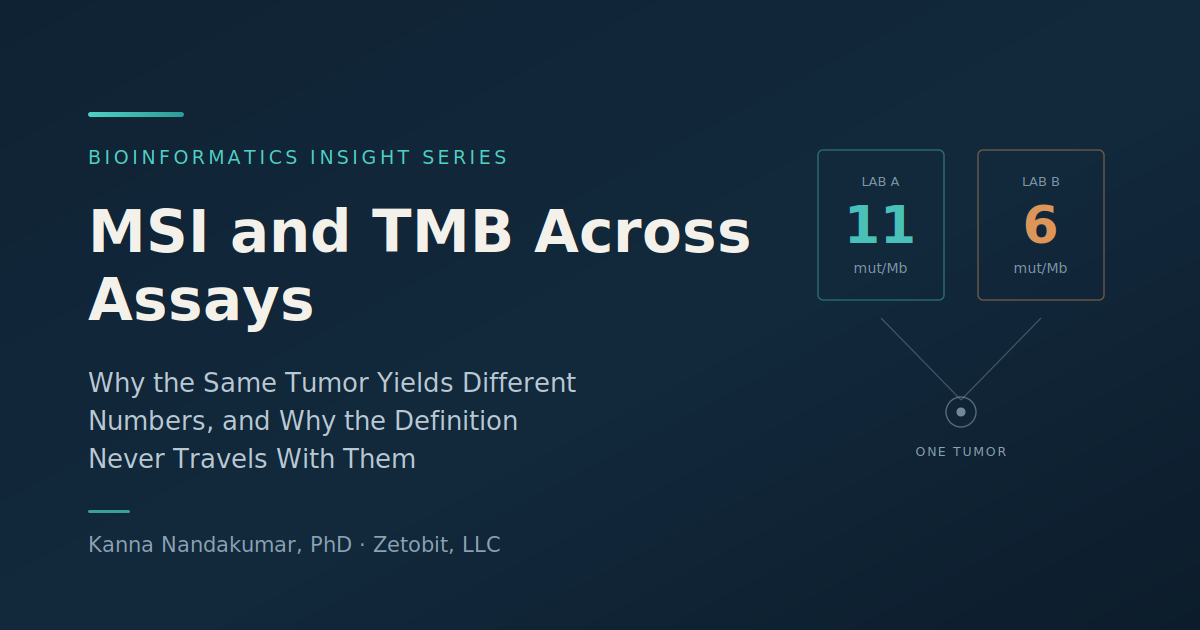
MSI and TMB Across Assays: Why the Same Tumor Yields Different Numbers
Two laboratories receive tissue from the same block. One reports a TMB of 11 mutations per megabase; the other reports 6. Neither made an error. TMB is not a physical property measured with differing precision — it's a quantity constructed from a definition that includes which territory was sequenced, which variant classes were counted, how germline was removed, and what the denominator was. Change any of those and the number changes legitimately. When 16 laboratories ran the same 29 samples, a calibration tool fixed most of the spread — which is the strongest possible evidence that nobody was wrong and nobody was measuring the same thing.